Smart data dashboards - helping the FE sector understand its workforce
We've made good use of Google Charts in our development of the new Staff Individualised Record (SIR) data collection and reporting system for The Education and Training Foundation.
In the past the SIR has been collected annually from just FE colleges but this year all work based learning providers will be encouraged to upload anonymised workforce data during the July/August submission window.
Providers who take the time to submit staff data not only help the sector - the Foundation uses the data inform the design and delivery of new programmes - but they also get to try out the new interactive data dashbords. Providers can use the dashboards to benchmark themselves against other providers at regional and national level and compare themselves with organisations that are similar in size and type. The dashboards make it easier for providers to spot trends over time - changes in levels of pay or the percentage of FTE staff in different job categories for example.
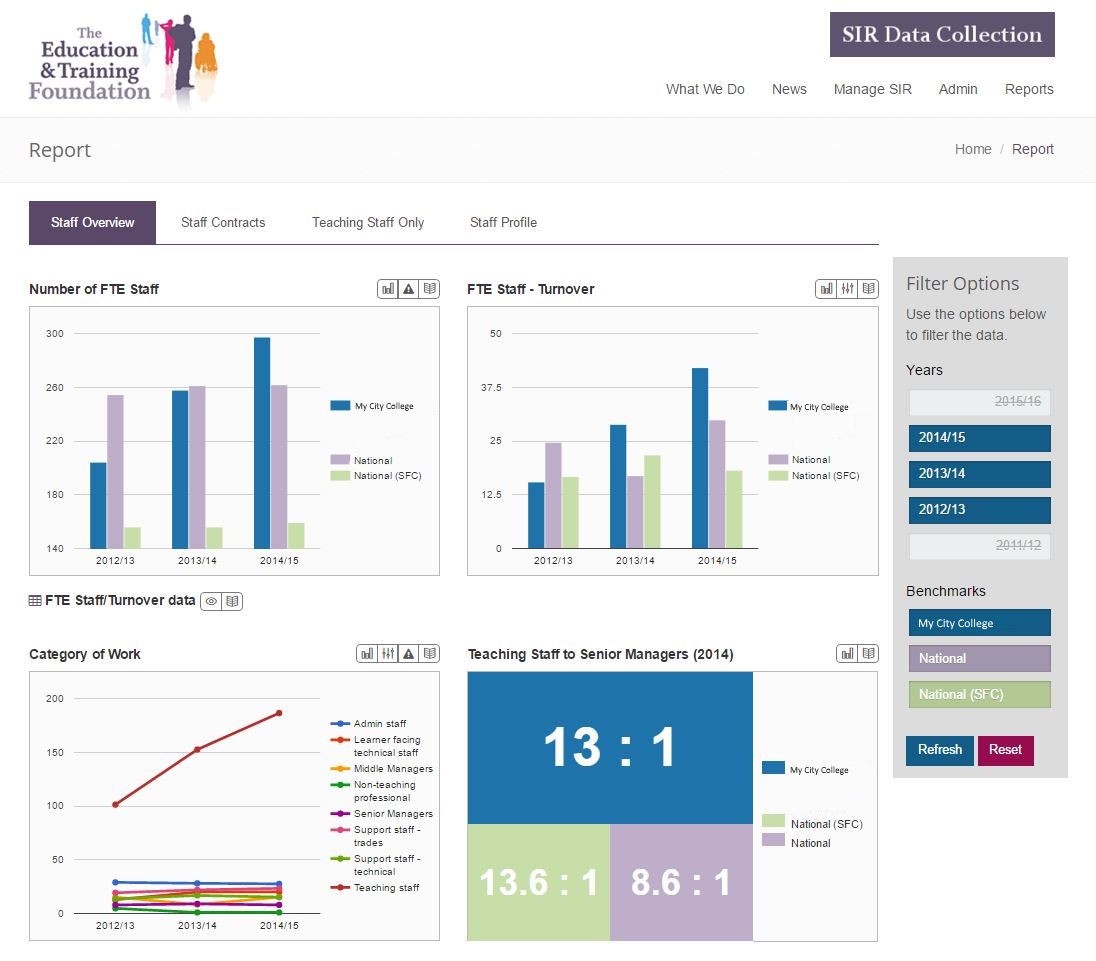
Two key design goals of the dashboard development were usability and data accuracy - it's important that users have confidence in the data and that they understand how anomalies in the charts can be caused by problems in the data they upload.
For each dashboard chart there is:
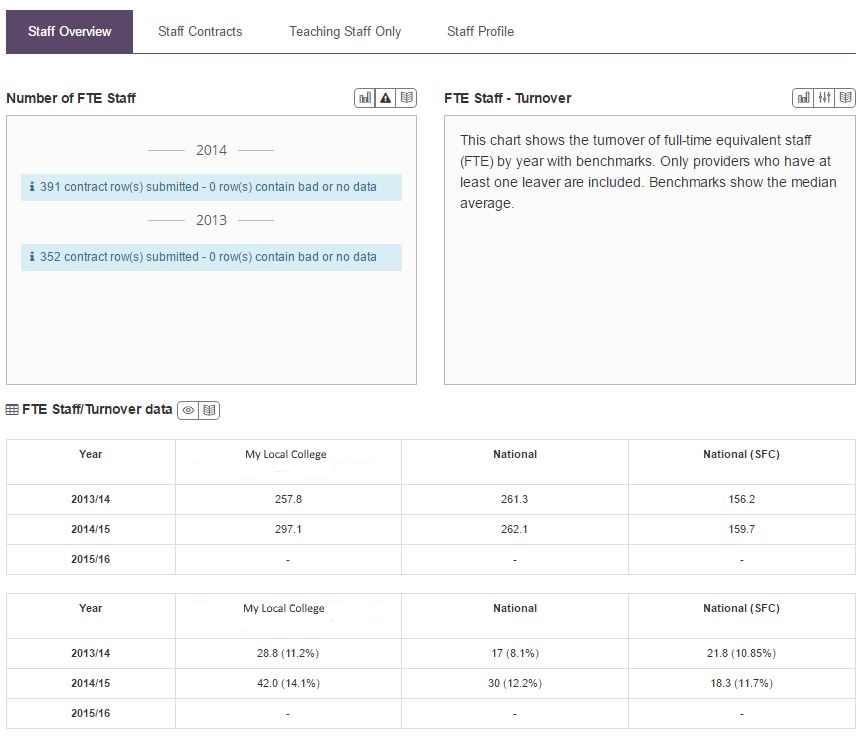
- Some background to the chart that explains in plain English what's being shown
- A list of errors that we think we may have found with the uploaded data
- Some configurability - for example switching between numbers and percentages.
We also provide some data in a tabulated form, again to make comparisons easier. A simple menu to the top right of each chart switches the view between chart, errors, config and explanation.
A third key design goal was that providers who upload data during the July/August submission window should get to see their data in the dashboards immediately after upload so that errors can be spotted quickly and data can be re-uploaded. The new system architecture means there's no delay in transferring data into the PostgreSQL based data warehouse part of the solution though we do wait until the submission window has closed before aggregating provider data for the calculation of the local and national benchmarks.
There's more information on the Education and Training Foundation's website here for anyone - from FE colleges, work based learning providers or an adult and community learning providers - who would like to know more about how to submit data when the window opens in July and then get access to the new dashboards