Analysing FE Workforce Data - Supporting the Post 16 Area Review
The post-16 area reviews are part of the government's plan to restructure FE and sixth form colleges. The idea is to make post-16 providers more financially stable and efficient. Providers are going to be encouraged to collaborate more - that could mean more shared services and in some instances, college mergers.
SkillsLogic is currently working with The Education and Training Foundation to design and build the next generation staff individualised record (SIR) data collection system. This is a large scale web application that will collect anonymised workforce from FE colleges, adult and community learning providers and other work based learning organisations. Training providers who submit data each year will also get access to a suite of interactive data dashboards that will allow them to benchmark their organisation against similar organisations both locally and nationally. The Foundation also gets a clearer picture of workforce patterns and trends within the sector.
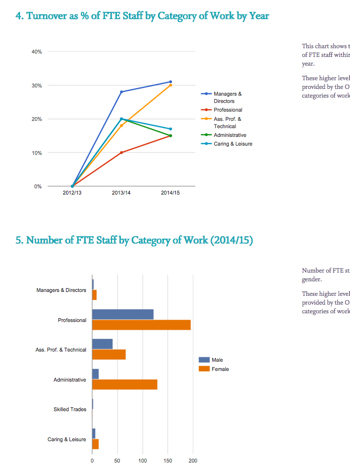
The new SIR data collection system also holds SIR returns from previous years and one of the quick wins of the current development is that we've been able to generate interim dashboards for colleges that are part of the area reviews. Colleges that submitted reasonable quality data in previous years get an 'interim dashboard' report from the Foundation that gives them a breakdown of their workforce (job types, hours worked, pay and skill levels etc.), shows them trends over time and makes comparisons with similar organisations at regional and national levels.
The data visualisations in the interim reports were built with Google Charts - the same technology we're using to build the dashboards in the main SIR development. Google Charts are a great way to build attractive interactive data visualisations into a web application - they’re free, highly customisable and the supporting developer materials are good.
Most of the heavy lifting though was done in the data warehouse. Historical SIR data was imported from a legacy SQL Server system into the new PostgreSQL warehousing and reporting database. The biggest part of the job was then deciding how to handle poor quality data and gaps in data - the interim reports are generated automatically and charts built on patchy data can be seriously misleading. A significant amount of time has gone into 'cleansing' data and working out the 'rules' that say when data should or shouldn’t be included in benchmarks.

The end result though is a nice summary for each college that they can use as part of their discussions with the Area Review steering groups. Colleges can see staffing trends over time, compare the numbers of teaching vs. non-teaching staff and highlight strengths in skills amongst lecturers.

