Cumulative Total Sales Forecast in Power BI
I wanted to build a sales pipeline dashboard in Power BI that shows the cumulative or running sales forecast over time. It also needs to show the running total of 'wins' and 'losses'.
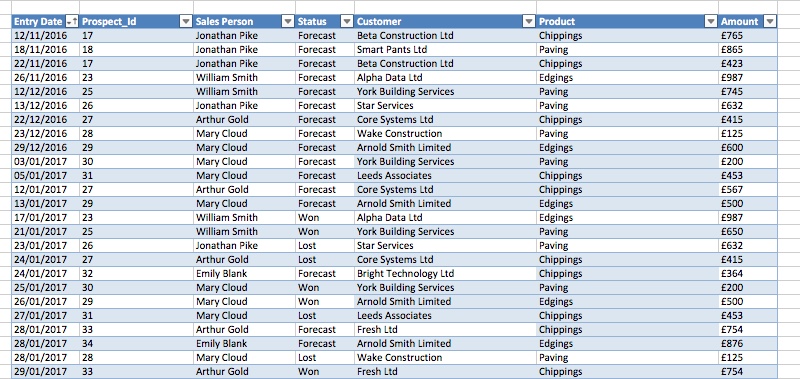
The data comes from Excel. It's a simple flat list - each row is either a latest forecast, a win or a loss. Existing rows are never edited, instead a new row gets added every time a forecast changes. Related rows share the same Prospect_id.
I wanted to give the user a chart that shows how the size of the sales pipeline changes over time. One of the harder tasks was working out how to calculate the running total of open 'Forecasts' at a particular date.
The running total at a particular date is the sum of all the 'open' forecasts at that date - the sum of the most recent forecast for each Prospect_id. It sounds reasonably straightforward - rows with a status of 'Forecast' are included in the running total at a particular date if:
- There’s no corresponding 'Won' or 'Lost' row with the same Prospect_id as a 'Forecast'.
- The 'Forecast' row is the most recent for that Prospect_id at that date.
It took me a while to puzzle out how to use DAX to do the calculation. In the first instance I decided to create a calculated column. The forecast_running_total is calculated for each row in the data and because it's a calculated column rather than a measure, the data doesn't change when the user filters their view of the data with data visualisations in the dashboard.
Here's the complete DAX expression for the forecast_running_total calculated column:
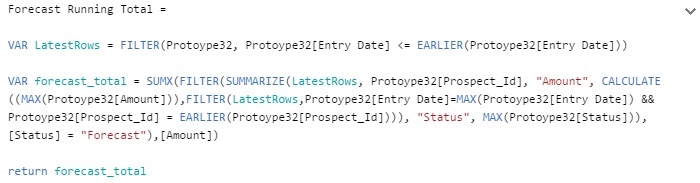
The first thing I do is grab all the rows up to and including the date of the current row. That filtered set of rows is assigned to the variable LatestRows.
VAR LatestRows = FILTER(Protoype32, Protoype32[Entry Date] <= EARLIER(Protoype32[Entry Date]))
Next I use LatestRows with the SUMMARIZE function to create a summary table where each row is a different Propect_Id - so I'm basically doing a GROUP BY on Prospect_Id.
I want that summary table to show the most recent row for each Prospect_Id. The columns for the summary table are 'Amount' and 'Status'.
This is the DAX that gets the 'Amount' for the summary table:
CALCULATE((MAX(Protoype32[Amount])),FILTER(LatestRows,Protoype32[Entry Date]=MAX(Protoype32[Entry Date]) && Protoype32[Prospect_Id] = EARLIER(Protoype32[Prospect_Id])))
I filter LatestRows so that I get the most recent row where the Prospect_id is equal to the Prospect_Id of the current row in the table that's being created by the SUMMARIZE function. The key to this is the EARLIER function - we loop through the rows in LatestRows looking for rows where the Prospect_Id matches the Prospect_Id of the outer loop - the id of the current row in the summary table that we are building.
FILTER(LatestRows,Protoype32[Entry Date]=MAX(Protoype32[Entry Date]) && Protoype32[Prospect_Id] = EARLIER(Protoype32[Prospect_Id]))
The last 2 parameters passed to the SUMMARIZE function are 'Status' and MAX(Protoype32[Status]) - we’re simply getting the status ('Forecast', 'Won' or 'Lost') of the most recent row for the Prospect_Id we are currently interested in.
That's the hard part done. Now I pass my summary table - the table that's returned from SUMMARIZE() - to SUMX(). I filter the table on [Status] = 'Forecast' and use SUMX() to return the sum of all the amounts for the rows up to and including the date of the current row.
This is the end result - a chart that shows how the sales pipeline changes over time. The chart also shows the running total of prospects won and lost. Again, both are calculated columns and they both use almost identical DAX expressions to Forecast_Running_Total though with a final filter on 'Won' or 'Lost' instead of 'Forecast'.
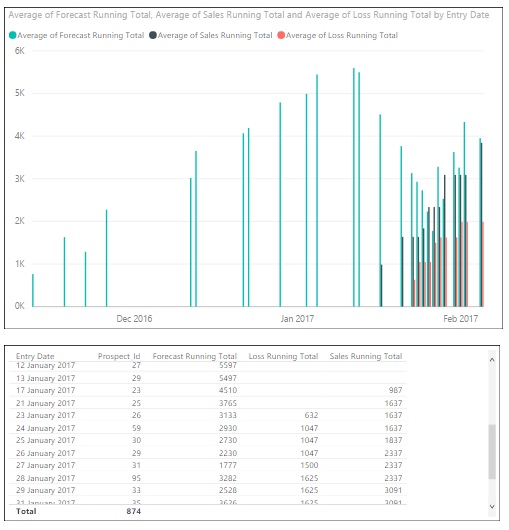
Remember, I've created a calculated column, so the DAX expression runs for every row of the original data and the data is fixed - it doesn't change when the user applies filters in the report. What I can't do with this is filter a chart to show the running totals for a particular salesperson, customer or product. That needs a measure and is the subject of a future blog post.