Power BI - How to show rows excluded by slicer
This was a problem that took me a little bit longer to solve than I expected.
We’ve developed a business intelligence solution for a training organisation that works with schools and teachers. The back end data warehouse is built in SQL Server and hosted in Azure. The front end is a Power BI reporting solution - a set of management information reports for drilling into data about course enrolments, website registrations and other kinds of engagement with teachers.
Our client wants to see course enrolments and website registrations for a single school. They can use a slicer to pick a school and then see a summary of the courses they’ve delivered to teachers in the school and also website registrations - the teachers who subsequently registered on our client’s website to get access to free course materials.
Creating that simple report was easy. The real work - loading and cleaning data from different operational systems- is all done in the data warehouse. I connect to the data warehouse from Power BI and I can then see three tables - course_bookings, schools and website_regsitrations. Power BI creates relationships between the tables (based on each school’s unique reference number) and I can quickly build the basic report.
The next step was harder. I wanted another table visualisation on the same report to show courses delivered to teachers in similar schools in the same geographical area as the one selected in the slicer - but not including the one selected. In other words, I want to see the rows excluded by the filter that’s applied when you select a school in the slicer. I also want to see total training hours delivered by each course.
The solution is based around a new measure called ‘Total Training Hours’ on the course_bookings table. Here’s the DAX for the measure:
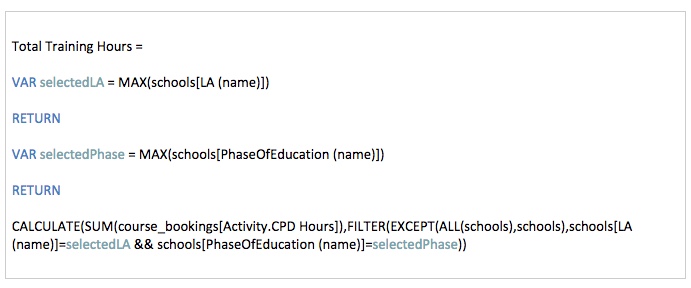
The breakdown of the solution is:
- There’s a one-many relationship between the schools table and the course_bookings table.
- Two variables in the measure capture the name and phase of the school selected in the slicer.
- I sum up and then return the training (CPD) hours booked by each school.
-
The FILTER used within the SUM function is the important bit. This is what we filter on:
EXCEPT(ALL(schools),schools),schools[LA (name)]=selectedLA && schools[PhaseOfEducation (name)]=selectedPhase
EXCEPT(ALL(schools),schools) gives us all the schools except the one selected in the slicer. And then we use the two variables to narrow down to schools in same local authority and the same phase of education (primary, secondary etc.) as the one selected in the slicer.
The new measure is then used with two other columns to create a new table on the report - school_name, course_name and ‘Total Training Hours’. We’ve now got a report that lets you select a school, look at it’s course and website registration history and then compare it to similar schools in the same area.
The solution - built around the Total Training Hours measure took some working out. It was the solution to this question on the Power BI community website that pointed me in the right direction: