Power BI - Dashboards vs. Reports
Dashboards and reports both appear in the Power BI online service. At first glance they seem to be very similar and anyone coming to the Power BI service for the first time from the Power BI Desktop application will wonder why we need dashboards when we've already got interactive reports that seem to do almost the same job. The are some important differences though and dashboards will make a lot more sense when you think about how they might be used.
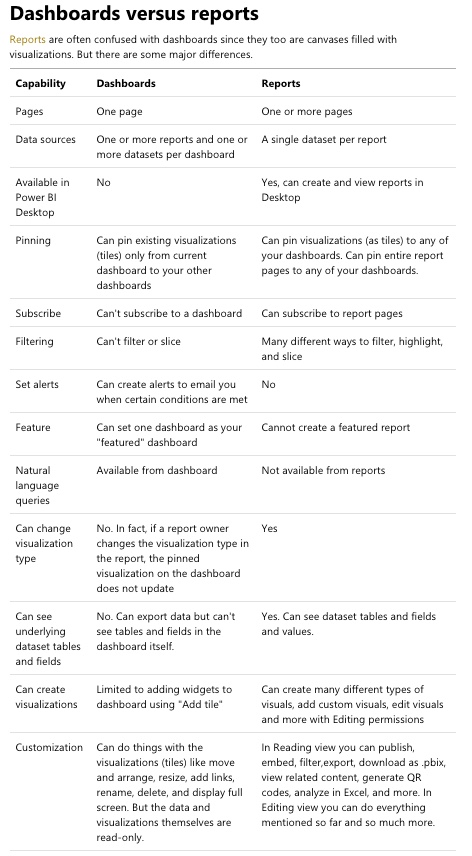
Power BI Dashboards and Reports - Main Features:
The important thing to remember is that dashboards are a way of bringing together data from different reports to create an overview or summary; dashboards are nice way of pulling out headline data from several reports and bringing it together in one place.
And dashboards can be shared with colleagues - this also makes sense because there are many scenarios where it will be better to send colleagues a single summary dashboard that sits on top of several detailed reports rather than send them the separate reports directly and ask pull out the headline data. And of course they still get access to the underlying report if they click a visualisation in the dashboard.
Part of the confusion around dashboards and reports probably comes from the language. Many of us default to 'dashboards' when we mean reports, at least in Power BI world. The difference between them begins to make sense when you start to more how they might be used - particularly in organisation where people might be asked to work with multiple reports.