Power BI - DAX Functions - CALCULATE and ALL
This example shows you how to CALCULATE and ALL in Power BI to create a simple measure that returns the start date for each unique run or instance of a course.
We have a client that provides careers support and training to teachers. One of the things they've asked us to do is build Power BI reports on top of data from their course booking system. They want to know more about the popularity of their courses across different types of organisations and different groups of teachers.
The course booking data comes to us in a single big denormalized table. Like a lot of training providers, our client will run the same course more than once - there are multiple instances of the same course. And each of those course instances can consist of one or more sessions.
So in our source data, each row is basically a teacher on a session that belongs to a particular instance of a course. We’ve got the teacher's name in each row, various dates, course name, instance identifier, organisation name and other bits and pieces of useful denormalized data.
On one part of my report I wanted to summarize the data and create a table visualization that looks like this:
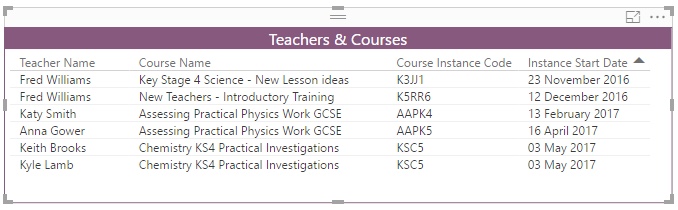
The Instance Start Date column needed a simple measure:

The breakdown of the solution is:
-
CALCULATE evaluates an expression in the context of an applied filter.
CALCULATE(, , …)
The expression is the first parameter. You can also pass in one or more filters that set the context over which the expression is evaluated.
In this instance we're using MIN as the expression in the first CALCULATE parameter to give us the earliest [Session Start Date] from the vbooking table. -
The second parameter that we pass to the CALCULATE function is this filter -
ALL(vbooking[Session Start Date]))
ALL works across all the rows in the [Session Start Date] column - we're looking for the earliest 'Session Start Date'' across all the rows in the [Session Start Date] column where there is a match with the other columns (Teacher Name, Course Name and Course Instance Code) in the table visualization.
This simple measure now gives us the start date - the date of the first session - for each instance of a course.